Here’s the link to the interactive version: (WT20 BATTING)

I’m going to look into Rohit Sharma’s numbers, that average is incredible.

Here’s the link to the interactive version: (WT20 BATTING)
I’m going to look into Rohit Sharma’s numbers, that average is incredible.
When it comes to total shots, per game, Liverpool have racked up more than any other team in Europe. That equates to five more than Barcelona, every single match. Only Juventus, Real Madrid and Tottenham come close to the Reds.
(Data correct up until the 1st March 2013)
At home this season, Liverpool average 23 shots per game according to Who Scored and rank top of all the teams in Europe’s major leagues. Manchester United ranks a lowly 22nd with 16.2 shots per game at Old Trafford; however, Ferguson’s team have collected 36 out of 39 points (92% of points available or 2.76 points per game) whereas Rodgers’ Liverpool won just 24 out of 42 points at Anfield (57% or 1.71ppg). The same trend is true away from home.
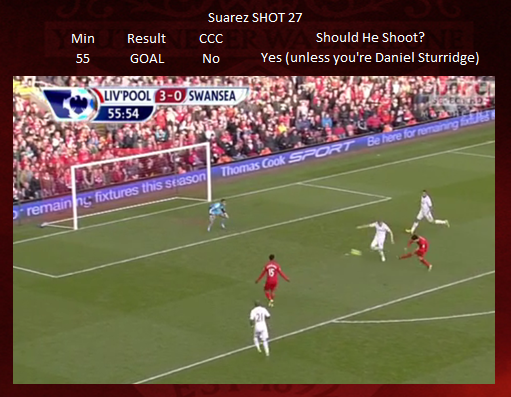
There was also another stat, read to me by Paul after the Swansea match, that claimed we had more attempts on goal (or shots) in that one match (35) than any other team in any other game, in Europe’s major leagues this season. Quite an achievement, even if we only get three points, and Laudrup did rest his defence and top scorer. My shock was compounded the next day, when completing the stats round-up I discovered Liverpool had 22 attempts in the first half and only 13 in the second. My perception was the other way round. I thought we controlled the game first half, and battered them in the second. So I thought I’d take a closer look. Watch the game again and take a screenshot at the moment each shot was taken. Then try and decide if this was the best option at the time. I was going to look at various shots, from various games but after watching the game again, I’m fairly confident this small sample, from one match, in one season, provides enough evidence to at least address some of the more persistent problems Liverpool have been having when it comes to taking the right shot, at the right time. It’s useless topping the shots on goal table, if you’re converting less than anyone else in the league.
I think we’ll discover a number of occasions when taking a shot on goal was the wrong option, just to lay my bias on the table from the beginning. I’ve been frustrated by this issue for over 18 months now. We seem to control games, have many more attempts on goal, but still continue to be wildly inconsistent in terms of results. It will also provide a little insight into the fascinating world of manual stat collection, and how the definitions can be tricky. I counted nine Clear Cut Chances, Opta counted six. That will also be added to the poll, to see if we fans think differently to the professionals.
Each shot slide will have the name of the scorer, the result of the shot (on target, off target, blocked), is it a Clear Cut Chance or not and my own answer to the simple question: should he shoot? I’ve kept it as simple as possible because there are so many different factors that go into the decision to shoot. Primarily, is it a clear instruction from the manager to shoot on sight? Next, do you see a better option? Either trying to beat a defender or pass to a team mate, in that split second? Finally, are you a selfish player? There are more, and it could be a number of factors working together at the same time. Nevertheless, I’d rather stick to one option for each slide and poll. Although I will expand on a few of them (particularly the shots that shouldn’t have been taken), the specific job of weighing up the various options each player had (with a degree of credibility), in each scenario, is one for the ex-strikers in the comments section to explore. I was a goalkeeper; I didn’t have ‘vision’ and nor was I ever clinical.
Before we look at the first slide, here are the definitions for all the different metrics that will be considered during this analysis:
Shot on target
Any goal attempt that:
1) Goes into the net
2) Would have gone into the net but for being stopped by the goalkeeper
3) Would have gone into the net but for being stopped by a defender who is the last man.
Shot off target
Any goal attempt where the ball is going wide of the target, misses the goal or hits the woodwork.
Blocked Shot
Any goal attempt heading roughly on target toward goal which is blocked by a defender, where there are other defenders or a goalkeeper behind the blocker.
Big Chances/Clear Cut Chances
A situation where a player should reasonably be expected to score usually in a one-on-one scenario or from very close range.
Liverpool’s shots against Swansea, at Anfield, on 18/02/13

First up our new Brazilian talent Coutinho, on his home debut, with just a minute on the clock. There are eight players between him and the goal, and that’s not including Sturridge or Vorm. Downing is free (don’t laugh) but this will also drag the Swansea players over, freeing up the three Liverpool players stood in a bunch. However, this is the problem analysing with hindsight and trying to predict what would have happened. That’s impossible. We can only speculate. Put yourself in Coutinho’s flair-filled boots for a second, and imagine being shown this image after the game. Would he agree with me? Should he pass, or turn inside? Or would he stick to his guns and say he’s happy with his decision? If Suarez was stood there instead of Downing, does that make any difference?
In the stats, Coutinho has had one shot, but it doesn’t impact on his own shooting accuracy or conversion rate, because the shot was blocked. It is also recorded in the total shots for the team.

The corner is floated in, it looks perfect, and it even looks planned from Gerrard. Downing looks set to “put his laces through the ball” before the Swansea defender tries to head it away, missing the ball, but putting poor Stewart off his stride and making the volley look like a decent return in a game of tennis-football, a lame lob, out for a goal kick. That’s my excuse anyway.

Tough one. At first glance I thought he could have squared it for Coutinho, who was free in the middle. Then watching the action from a different angle, I’m not sure it was an option. One other issue is the Swansea keeper Vorm, who appears to be anticipating a cross from Suarez. The end result was a save, as the shot was straight at the goalie.

It’s on his favoured side to curl it around the defenders closing him down, into the far corner. Or strike it and hope for a fortunate deflection. I just don’t think it’s a high percentage attempt. And surely, that’s what we should be aiming for? If Manchester United can take 7 less shots than us per match (on average), but still win every single game, bar one (and in that they scored twice) at home in the league, then they must be waiting for better opportunities. They must be creating chances or shots that have a greater chance of scoring. It can never be an exact science, and the ability of their players must be the key factor. But surely part of that ability is deciding it’s not a good time to shoot. To wait, pass it to a teammate and run in behind, or even recycle backwards and drag your marker away from the centre. It might sound harsh, it might sound ridiculous to some, but we need to stop shooting from distance when opposition players are clearly in the way. (Unless your name is Suarez, from a free kick, in the Europa League, at Anfield.)


This is similar to Downing’s earlier effort. Too speculative, and don’t get me wrong they are brilliant when they fly into the net, but the chances of that happening are slim. I’d much rather Sturridge waited to take advantage of his superior finishing skills closer to the goal. Still, it was blocked and went for a corner. But was the shot worth the risk? Not for me. The ends don’t justify the means. Although, I accept there is a stronger case than for Downing’s earlier attempt; Sturridge’s superior ability, fewer men forward, it could deflect off the keeper and into Suarez’s path, it could go in.

You have to trust your wide forward, on his stronger foot, to shoot from this position. A clearer sight on goal, players waiting to pounce in the box, or latch onto a miss hit shot that’s sliced along the floor.
Shame then, he sliced it in the air, over everyone’s head (it nearly went out for a throw-in). You wouldn’t think I had a soft spot for Downing, would you? Based on this game, he didn’t have his shooting boots on. Based on this season, he’s also got a terrible shooting accuracy. My preference, Stewart, is to wait till you’re three yards out and Coutinho’s floated over a perfectly weighted cross for you to put your head on before turning away with your arm up like Alan Shearer.


Because JoeP, during the Zenit second leg, tweeted that a free kick for Suarez from this position “was basically a penalty”. He’s right. He has to shoot. Here’s a great quote from Suarez about Rodgers’ advice, and his own routine and thought processes:
As well as extra hours on the training pitch, Suarez’s ability to navigate both goalkeeper and wall has been aided by some notes from Brendan Rodgers.
“Every player has his own particular skill and technique when taking a free-kick,” said Suarez.
“But sometimes the free-kick might be from a different position, or you might have to study the ‘keeper’s technique when making a save, the position of the wall, whether they jump in the wall, if the defenders are tall and if you can get the ball up and over them.
“The manager is really good at this preparation. Before a game he shows the free-kick takers footage on dead-ball situations and that’s also important.”

No one following up, Coutinho in space to his left, Vorm stood fairly close to his line; ball drops nicely, Suarez can score from 45 yards, no-one has been able to catch him to make a run alongside or in front of him. Again, all of this is subjective, but on balance I think he’d be better off keeping control of the ball and looking for another option.

Another tricky one that I’ve got marked down as a CCC: he’s one v one, close range, and should “reasonably be expected to score”. The timing of his jump is slightly off, and he can’t get his head over the ball to direct it underneath the bar.

Just the keeper to beat, close range, has to shoot, has to score, really. But is it a CCC? It is for me.

Again, very similar to Downing’s earlier that was dragged wide past the near post. Here, Sturridge has one less player in the way to block it. Maybe a quick 1-2 with Suarez? He hits the target, but his shot is straight at Vorm.
We’ve had 14 shots before the half hour mark. Two of them were on target, two of them were CCC’s in my eyes, four of them blocked, six of them inside the box, and eight off target.

Lay it off to Johnson surely? No one is close to him. Lucas gets a decent contact but it’s straight at the keeper. He’s not exactly renowned for 25 yard thunderbolts, although this season his comprehensive shooting record reads: three shots, one on target, two blocked, 100% shooting accuracy. The one above is Lucas’s sole shot on target this campaign. He is, however, renowned for recycling the ball, reading the play, interceptions, covering attacking players, being a thoroughly decent person. Also, play to your strengths, we’ve got 3 on 2 at the back post, if he passes to Johnson and he crosses it first time.


Sturridge is one on one with Vorm, from close range and should reasonably be expected to score. Although if he squares the ball along the ground, it’s a tap-in for Coutinho. I think he’s caught in two minds, kind of ‘dinks’ it over Vorm but in the direction of the Brazilian, only to under hit it and it comes to nothing.
Below is a look at the table of shots from the first half:

In the first half, before we scored, we’d attempted 16 shots on goal. Only three were on target, and five were blocked. Only 37.5% of shots were inside the box, before the penalty. This chimes in nicely with the theory that a teams’ shooting accuracy fluctuates depending on the result at the time, and also that a team takes more speculative efforts when they are level or chasing the game.
Half-time research:
Scoring Efficiency and Current Score by Mark Taylor (on the Opta Pro website)
…The tie appeared remarkable for many reasons. Not only had Chelsea played over half the second leg with just ten men and Messi had missed from the spot, but they had also enjoyed less than twenty percent of the possession and had been out shot by a ratio of 3:1over both legs. They had managed just 3 shots compared to Barca’s 14 in their 1-0 win at Stamford Bridge and had fared only slightly better in going down 16-7 in the return. But as Fernando Torres had so clinically demonstrated in the final minutes of the tie, having the lion’s share of the shots isn’t as important as how efficiently you finish them and Chelsea had outscored the Spanish giants by 3 goals to 2 in the column that mattered most…
Arriving at conclusions on the basis of one game or one incident is usually unwise, but it appeared that Chelsea’s 30% strike rate owed something to the simplicity of the Torres chance and Barcelona’s 7% strike rate was the result of their opponents being able to pack their backline because they had only been behind in the tie for two minutes. Before we can begin to draw wider conclusions we need to work with a larger and more detailed set of results, therefore I’m grateful to Opta for providing a season’s worth of shot statistics for Arsenal from the 2010/11 season:
Efficiency and Frequency of Arsenal’s Shots (2010/11)

Origins and Outcomes of Shots taken by Arsenal in Differing Game Situations (2010/11)

It’s worth keeping all the above in mind before moving on to the shots from the second half. When we were level, we had lots of speculative shots from outside the area. We had very few clear chances. It’s also worth remembering that I’m ignoring the context of the match when deciding if the player should shoot or not. Treating each shot as its own individual, exclusive, event. Looking at the type of shot, the estimated risk/reward scenario and whether or not there were better options open the player shooting. I’m more interested in finding the type of shot we should be avoiding.

So in the second half, we’ve changed from taking 37.5% of our shots inside the area before the goal, to 66% after it. Swansea trying to score, inevitably push more players forward, leaving more gaps at the back; we pick them off and take advantage of easier chances. The difference is clear. And to an extent, it’s obvious. It’s just fascinating to ask the question: why can’t we wait for better chances when we’re level or behind or is it simply because clear chances don’t present themselves when a team is happy to sit back and let you come at them?


Of course he should shoot. Although, it is another tough one to make a clear decision. Initially, I thought he should, but in the more conventional manner by wrapping his foot around the ball and steering it toward goal. However, and I couldn’t get the exact frame for the shot, but it appears the ball from Suarez was just behind him. So the little flick was probably his only option (could he have laid it off for Sturridge?).


Suarez scores. We know he scores and we know it’s a wonderful finish. But look at Sturridge, waiting for a tap-in. Ignoring the result of the shot, ignore the context of the match itself, and weigh up the risk/reward ratio. I’m leaning toward yes, on the assumption most strikers are going to shoot, on instinct. Would Sturridge pass to Suarez in the same spot? I doubt it.


I’ve included every shot from the game, so you can make your own mind. Are you from the ‘shoot on sight’ camp or are you from the ‘Patience Dear Johnson’, shooting from 48 yards is never going to work, especially when you’ve attempted 45 shots (from a variety of positions) this season and only converted one of them (3% chance conversion) camp? That’s more shots – this season – than Mata, Cisse, Andy Carroll, Dempsey, Hazard, Lampard, Grant Holt and Shane Long. If your chance conversion rate is no better than 1 in 45, pass it. That’d be a good starting point.
Full Time Research:
Luis Suarez: Stuck in the middle, from one of my favourite blogs, ’2+2=11′ by TTT subscriber WillGM.

The first thing to note about the goals Suárez scores is that across both seasons, the vast majority of his goals come from relatively central areas within the penalty area or just on the edge of it. Furthermore, we can see that Suárez appears to shoot a lot from locations where he doesn’t generally score from.
There is more data available, across a sample of 15,000 Premier League shots. The football blog ‘differentgame’ put together the Shot Position Average Model (SPAM). Here’s the results, although they take a slightly different approach to Will, and reduce the number of sections down to six: penalty area central, penalty area right, penalty area left, outside the penalty area, direct free-kicks and penalties.
Penalty Conversion Rate (CR): 1 in 1.35
Direct Free-Kick (CR): 1 in 20
Penalty Area Central (CR): 1 in 6
Penalty Area Right (CR): 1 in 19
Penalty Area Left (CR): 1 in 19
Outside the Penalty Area (CR): 1 in 33
If we now match this up against Liverpool’s last four matches (Wigan away, Swansea home, WBA home and Man City away) and plot each shot we’ve attempted (using Will’s method as a rough guideline) and calculate a conversion rate, we can see a similar pattern emerging.

As you can see, even with such a small sample of four games, we still generally only score when we shoot from central areas. No goals whatsoever from any other area. Here’s a breakdown of the numbers.

As a team, our conversion over the last four games is better than our season average. Even with the WBA performance. All the evidence points to waiting till you’re in a central area before taking a shot. I would add a caveat of making sure you have a clear (ish) sight at goal.
Post-Match Analysis:
Everyone’s favourite comparison: Liverpool vs. Manchester United

As we’ve already established, racking up the number of total shots we attempt isn’t in doubt. We’re the kings of shooting, the dominant force in the world of needless, wasted opportunities. What about Shots on Target?

Again fairly even across the last few seasons. So what is it that accounts for the discrepancy in points totals? The next two graphs should go some way to answering that question. They’re, quite simply, more clinical than us. We have more shots, the shots on target are virtually identical, but as we move towards shooting accuracy and chance conversion, we can see the difference.

As we can see, Man Utd have had a higher shooting accuracy in every season apart from in the Hodgson/Dalglish season. Without having the detailed data to analyse where Man Utd shoot from, and if it”s markedly or even subtlety different to ours, it’s hard to know for sure if they shoot from more central areas, do they wait and pass? Do they pick the ‘right’ option more than we do? Or, are their players just better at shooting, than ours?

Finally, the gaping hole in our team. Converting chances. Look at the difference. It’s basically why they win the league, and we don’t even challenge. The last time we challenged, we virtually matched them. Since then, they have soared upwards whereas we have had to watch game after game of Barn Door Challenge.
As is the TTT way, this is to start the debate, not come to definitive conclusions. I hope I’ve presented the data, as well as the detail. The macro and the micro to feast over and analyse. Personally, I think we can cut out all shots from outside the area that are not central. That would be a start. Otherwise, I’m very optimistic we’re moving in the right direction. Attacking players with a variety of complimentary skills. Hopefully they can all add ‘decision-making’ to that list and realise when it’s the right time to take a shot. Not, just shoot, on sight.
Further Reading:
Premier League Goalscoring Patterns – EPL Index
They Shoot, They Score, But Should Less be More? – The Woolster
And here’s some analysis by Andrew Beasley on TTT in the subscriber only comment section (No trolls!). Make sure you check out his brilliant blog: http://basstunedtored.com/
Using the data on WhoScored, we can see how many shots per game both teams average from each part of the pitch:
| 6 yard box | 6-18 yards | Outside Box | |
| MUFC | 11% | 58% | 31% |
| Shots Per Game | 1.8 | 9.5 | 5.1 |
| LFC | 5% | 50% | 45% |
| Shots Per Game | 1.2 | 11.5 | 10.4 |
Straight away you can see that we have five shots more than them from outside the box every home match, and as they only have a 1/44 chance of being scored, that’s five shots down the drain right there (and almost half of our total shots, in fact).
You have demonstrated that we only seem to score from shooting centrally – WhoScored also have shot direction info. 62% of ours have been from the middle, and only 3 teams in the PL have a lower proportion. United on the other hand fire in 71% of their shots from the middle.
We also have the worst shooting accuracy at home in the league this season. No prizes for guessing who is top ![]()
| Team | Shots pg | Shots OT pg | Shot Accuracy |
| Manchester United | 16.4 | 6.3 | 38.4% |
| Reading | 9.1 | 3.4
|
37.4% |
| Everton | 17.6 | 6.5 | 36.9% |
| West Ham | 13.6 | 4.9 | 36.0% |
| Manchester City | 17.9 | 6.2 | 34.6% |
| Swansea | 16.6 | 5.7 | 34.3% |
| Arsenal | 18.4 | 6.2 | 33.7% |
| Newcastle United | 17.3 | 5.8 | 33.5% |
| Fulham | 15.4 | 5.1 | 33.1% |
| Chelsea | 19.2 | 6.3 | 32.8% |
| Stoke | 11.3 | 3.7 | 32.7% |
| Tottenham | 21.5 | 7 | 32.6% |
| Wigan | 14 | 4.4 | 31.4% |
| Queens Park Rangers | 14.9 | 4.6 | 30.9% |
| Sunderland | 13.3 | 4.1 | 30.8% |
| Norwich | 12.8 | 3.9 | 30.5% |
| Southampton | 15.1 | 4.6 | 30.5% |
| West Bromwich Albion | 15.5 | 4.7 | 30.3% |
| Aston Villa | 11.6 | 3.5 | 30.2% |
| Liverpool | 23 | 6.8 | 29.6% |
Finally, in case you haven’t seen it, I have plotted a graph showing our average points-per-game based on how many shots on target we have had since August 2010:
http://public.tableausoftware.com/views/LFCPPGbySoTsinceAug2010/Sheet1?:embed=y
8 is a bit of an anomaly, but otherwise the trend is both obvious and apparent. We need more shots on target!
*For anyone who thought the FA were in the dark ages, and when it comes to the appointment of a manager and their ability to handle sensitive off-field cases, they may be, but this piece of research (albeit by the Research Institute for Sport and Exercise Sciences, Liverpool John Moores University) is pretty forward-thinking, and with the vote in favour of coaching changes this year, English football might be moving forward, irrespective of the national team circus and pre-historic tactics.
Abstract:
The acquisition of soccer skills is fundamental to our enjoyment of the game and is essential to the attainment of expertise. Players spend most of their time in practice with the intention of improving technical skills. However, there is a lack of scientific research relating to the effective acquisition of soccer skills, especially when compared with the extensive research base on physiological aspects of performance. Current coaching practice is therefore based on tradition, intuition and emulation rather than empirical evidence. The aim of this review is to question some of the popular beliefs that guide current practice and instruction in soccer. Empirical evidence is presented to dispel many of these beliefs as myths, thereby challenging coaches to self-reflect and critically evaluate contemporary doctrine. The review should inform sports scientists and practitioners as to the important role that those interested in skill acquisition can play in enhancing performance at all levels of the game.
http://axonpotential.com/wp-content/uploads/2011/05/2003-Ward-Williams-JSEP.pdf
Brilliant research (2003) by Ward and Williams at Liverpool John Moores University
This study examined the relative contribution of visual, perceptual, and cognitive skills to the development of expertise in soccer. Elite and sub-elite players, ranging in age from 9 to 17 years, were assessed using a multidimensional battery of tests. Four aspects of visual function were measured: static and dynamic visual acuity; stereoscopic depth sensitivity; and peripheral awareness. Perceptual and cognitive skills were assessed via the use of situational probabilities, as well as tests of anticipation and memory recall. Stepwise discriminant analyses revealed that the tests of visual function did not consistently discriminate between skill groups at any age. Tests of anticipatory performance and use of situational probabilities were the best in discriminating across skill groups. Memory recall of structured patterns of play was most predictive of age. As early as age 9, elite soccer players demonstrated superior perceptual and cognitive skills when compared to their sub-elite counterparts. Implications for training perceptual and cognitive skill in sport are discussed.
Key Words: anticipation, memory recall, situational probabilities, visual function
It links in well with The Question: Do footballers know what they’re doing’ by Jonathan Wilson
Sir Donald George Bradman, born in Cootamundra, New South Wales, Australia on the 27th August 1908. Apart from playing for ‘The Invincibles’, the only team never to lose a game on a tour of England, his batting average, of 99.94:
“is often cited as statistically the greatest achievement by any sportsman in any major sport.”
So why, still, does cricket claim his achievement, because of his unorthodox technique, is down to genius and natural talent, without taking notice of the batting technique that still stands head, shoulders, knees and toes above any other batsman, ever?
He needed 4 runs, a fluent pull through mid wicket or a flick off his pads down to fine leg, a smashing drive through cover point or a scything cut shot. His repertoire was full, his ability unquestioned. He needed 4 runs. To average a 100, in every innings of his international career, in fact, all he needed was an inside edge down to fine leg. How many runs, over the history of this great game, have been unjustified? If ever Lady Luck, based on ability and achievement, could have applied her magic touch, this was the moment. The Don, who walked to crease to be received by rapturous applause, a cricketing rarity. This tribute usually the other way around, when you’ve scored the hundred. He scored 0. He still got a standing ovation walking off, despite the collective state of shock.
While the relative difference between 100 and 99.94 is statistically irrelevant, it has become a totem of impossibility.
What makes his achievement even more incredible, is that no-one, none of the thousands of batsman who have tried to match or even challenge his batting average, have come anywhere near.
Why didn’t cricket say, “Don, how did you do it?”
Well, some did.
In ‘Bradman Revisited’, written by Englishman Tony Shillinglaw, he explores the basic bio-mechanical structures of Bradman’s technique, how his method was formed, how it differs from the orthodox methods and who most closely resembles The Don in the modern game.
listen to ‘Don Bradman: Cricket’s Great Tragedy, Part Two’ on Audioboo
In one of the most important coaching manuals of the modern game, Bob Woolmer’s ‘The Art and Science of Cricket’ he mentions the questions that arise from Shillinglaw’s research.
“Why has recognized orthodoxy survived in the modern coaching manuals whereas no mention is made of Bradman’s technique and how it fails to conform to this orthodoxy? It is imperative that we investigate why one individual was able to have a ‘Test’ average 30% better than the next best average in the history of the game. Biological factors alone cannot explain this significant a difference – they do not differ by 30% between the very best and the next best human in any particular activity.”
He continues,
“In fact, a fundamental teaching in science is that it is dangerous to presume a cause unless it has been proven. Since we have no evidence that Bradman was biologically superior, we must entertain the possibility that Bradman’s brilliance might have been the result of his superior and unorthodox batting technique.”
Shillinglaw himself argues that Bradman possessed a series of qualities:
A different stance
An unusual pick up
Dancing Feet
Lightening Reflex
Exceptional Balance
Shot Certainty
Concentration
How many of those qualities apply to many of cricket’s great batsman? Brian Lara, Sachin Tendulkar, Barry Richards, Inzamam Ul-Haq, George Headley or, dare I say it, Kevin Pieterson.
But what was about Bradman’s technique that set him apart, by some considerable distance, from the rest of the sports batting elite?
Shillinglaw believed:
“the way Bradman held his bat, lifted it and prepared for each stroke. Shillinglaw believes this gave Bradman an important advantage in terms of balance and ensured he was always ideally positioned to play his shot. In other words, it was what Bradman did before a shot that set him apart, not the stroke itself.”
PART THREE: A water tank, a stump and a golf ball – the story of the game that made The Don
This wasn’t a whim from Shillinglaw, he’d been studying The Don for over thirty years. When he took the findings from his study to the relevant bodies, namely the MCC and other English coaches. Even then, in 2003, he found the old coaching manual was still being enforced.
Still being taught. The pendulum bat, lifting the bat back straight over the stumps, and making sure the bat travelled on a straight plane as it comes into contact with the ball.
During Shillinglaw and Hale’s research they struck up a correspondence Professor Noakes from (South African Sports Science University?) and he added further evidence, suggesting:
“I looked at 6 of Bradman’s major shots very carefully.”
“The key point was that when he lifted his bat out to second slip, when the bat comes down, it followed the path that is determined by the nature of the delivery.”
This is crucial. Instead of programming people to bring the bat down the same straight line, shot after shot, Bradman was reactive to each ball.
Whereas a large proportion of players are now encouraged to stick to their favourite shots. Some players might have a cut, a drive, a leg glance and, don’t forget, a forward defensive. Bradman had all the shots, not only that, his technique allowed him the freedom to play whichever one he wanted, depending on the delivery.
Noakes concluded:
“that Bradman had decided where he was going to intersect the ball and when he’d made that decision, then his bat started moving down the shortest possible way.”
His examples included two shots: The cross-batted pull shot and the drive.
“At the back of our home was an 800 gallon water tank set on a round brick stand. From the tank to the laundry door was a distance of about 8 feet. Armed with a small cricket stump (which I used as a bat) I would throw a golf ball at this brick stand and try to hit the ball on the rebound. The golf ball came back at great speed and to hit it at all with the round stump was no easy task.”
Yes, Bradman, also a master of the understatement. A golf ball and a cricket stump, mixed with 8 feet of distance, that’s how to learn cricket. Might not pass some of the health and safety tests for the school playground, however.
Bradman continues:
“To make my game interesting I would organize two sides consisting of well known international names and would bat for Taylor, Gregory, Collins and so on, in turn. The door behind me was the wicket, and I devised a system of ways to get caught out and of boundaries. Many a time I incurred mother’s displeasure because I just had to finish some important ‘Test Match’ at the very moment she wanted me for a meal. The open side of my playing area corresponded to the on side of a cricket field, and therefore I did not have to chase the ball for any shots on the off side.”
So while Bradman may have missed the odd meal, he was constantly reinforcing the most effective way to bat. The most effective way to hit a moving ball. But, no one else wanted to copy.
Bradman confirms:
“This rather extraordinary and primitive idea was purely a matter of amusement, but looking back over the years I can understand how it must have developed the co-ordination of brain, eye and muscle which was to serve me so well in important matches later on.”

Raw excitement, plenty of goals and end to end football; many observers believe this to be the appeal of the Premier League. The 2011/12 season has provided, especially between teams at the top of the table, a heady mix of all three. Just think of the 8-2 at Old Trafford, or Spurs twice conceding five, Arsenal going to Stamford Bridge and scoring the same amount or City doing the unthinkable, and putting six past Manchester United. While the tactical approach of each manager has been crucial to these results, the lack of a dominant, defensively disciplined ‘enforcer’ sitting in front of the back four, marshalling the defence, breaking up play and starting the attacks has been obvious.
Claude Makelele:
Often considered the best holding midfielder ever to grace the Premiership, Makelele arrived from Real Madrid for £16m after three incredibly successful years when he won two La Liga titles, a Champions League and a Spanish Super Cup. Signed by Claudio Ranieri, the departing Real Madrid president claimed Perez:
We will not miss Makélelé. His technique is average, he lacks the speed and skill to take the ball past opponents, and ninety percent of his distribution either goes backwards or sideways. He wasn’t a header of the ball and he rarely passed the ball more than three metres. Younger players will arrive who will cause Makélelé to be forgotten
Chelsea reached the Champions League Semi-Final for the first time in their history and finished second in the league. Ranieri was sacked, Jose Mourinho arrived, and Chelsea won two leagues titles in two years. They only conceded 15 goals in the first season and 22 the following year. This season, Chelsea had conceded 15 by the end of October. Makelele’s importance was highlighted by Mourinho after Chelsea’s incredible season; when Lampard and Terry were claiming all the individual honours, Jose stated he was ‘Chelsea’s Player of the Year’. A statement confirmed by Real Madrid’s legendary defender Fernando Hierro,
‘I think Claude has this kind of gift – he’s been the best player in the team for years but people just don’t notice him, don’t notice what he does. But you ask anyone at Real Madrid during the years we were talking about and they will tell you he was the best player at Real. We all knew, the players all knew he was the most important. The loss of Makélelé was the beginning of the end for Los Galacticos… You can see that it was also the beginning of a new dawn for Chelsea. He was the base, the key and I think he is the same to Chelsea now.’
Javier Mascherano and Xabi Alonso:
During the 2008/09 Liverpool enjoyed their most successful league campaign in the Premier League era, finishing second by four points (a record total for LFC), scoring the most goals and knocking Real Madrid out of the Champions League five-nil on aggregate. During that season, Rafa Benitez often played both players together in the same team, providing a solid platform for the attacking players to flourish.
Liverpool had one enforcer, screening the back four in Mascherano and one distributor in Alonso, finding the perfect pass, setting up a counter attack or just dictating the pace and tempo of the team. Lucas Leiva, since the departure of both players to Barcelona and Real Madrid respectively, has attempted to adopt both roles. With the disappointing performance of Christian Poulsen last year, Lucas made the most passes (1794) and the most successful tackles (111 – more than Carragher, Skrtel and Agger combined) and this effort was duly rewarded by being named player of the season.
Darren Fletcher, Paul Scholes and Michael Carrick:
All three of these players have played a crucial role in Manchester United’s success over the past four years. Sir Alex Ferguson even attributed Fletcher’s absence as the primary reason for the 2009 Champions League Final defeat to Barcelona. While Carrick has made the role his own this season, Ferguson had tried the blend the best elements from all three (including at times Ryan Giggs) into the crucial role just in front of the defence. If Fletcher has the energy, drive, tackling ability and tactical discipline to make up for the lack of Paul Scholes’ defensive ability, then that frees up Carrick and Scholes to dictate play for United going forward. Since Fletcher was diagnosed with a long-term kidney illness, Carrick has been used in deep lying midfield role more often. The constant injury problems of Tom Cleverley (perceived by many to be Scholes’ successor) has led to Carrick’s increased responsibility.
One crucial game this season, when Man Utd didn’t include, through choice or injury, either Fletcher, Carrick or Scholes, was away at FC Basel in the game that knocked them out of the Champions League. That day, Phil Jones played in the deep lying role, and United were left exposed at times. Here is the average position map from the game. Notice Jones’ positional inconsistency in the opening 15 mins, when FC Basel scored their opening goal.

Average for the whole game:

Phil Jones might yet turn out to be an outstanding holding midfielder, he certainly has all the attributes, but at 19 at the time, maybe a bit too much was expected of him.
Scott Parker:
The relative success of Tottenham this season is down to a number of factors, but the signing of Scott Parker who won the Football Writers’ Player of the Year last season, has been one of the most important. Again, similar parallels with the Mascherano/Alonso or Fletcher/Carrick/Scholes partnerships start to emerge.
Having that anchor has allowed Modric and Bale to flourish.
Arsenal:
A lack of a disciplined, tactically aware holding midfielder, who can break up play, protect the back four and allow the more attacking-minded players to succeed has often been cited as a reason for Arsenal’s lack of silverware over the last five or six years. Flamini was snapped up after two successful seasons in that role at Arsenal in 2008, but Diaby and Song have both attempted it, with occasional glimpses of success, but on the whole would be regarded as failures, when compared with similar players at other top four clubs.
Manchester City:
Perhaps the team with the most impressive set of central midfielder’s is Manchester City. Whereas last year Mancini was being derided for setting his team up too defensively with Barry, De Jong and Yaya Toure all playing in the same game; this season he’s tended to play two of three and has included Nasri, Milner or Johnson alongside David Silva.
It is no coincidence that Manchester City struggled most when Y Toure and Kompany were missing during January. The solid foundation of Lescott, Kompany, Barry and Y Toure has been fundamental to City’s league success this season. Keeping those four players fit for the final stretch of the campaign will decide whether The Citizens ship sinks or, after so many years, floats to victory.
Soccer is the most popular sport in the world, and fans from every continent flock to the World Cup every four years. However, it’s only fans in North America who still call the sport “soccer”; to the rest of the world, it’s “football.” This distinction is rooted in soccer’s origins in England and the clarification of rules to distinguish it from rugby.

Association Football
Kicking a ball around a field has been done in some form or another for around 2,000 years, and while in more modern times schools played kicking games based on their own rules, in the mid-1800s seven public schools in England got together to codify rules of a foot-based game. This was known as “association football.” This association became an official governing body when “undergraduates at Cambridge tried to unify the rules in the mid-to-late 1840s and those rules would largely be accepted on the evening of 26 October 1863,” according to the Football Association of England. However, Rugby School wanted to keep a rule that allowed players to run with the ball in their hands. This conflict led to a new sport called rugby. If the other six schools played the early version of modern soccer, then Rugby School played the earliest version of American football.
Early History of Soccer
The word “soccer” derives from a slang term using the “soc” part of the word “association.” Rugby players played “rugger” and association football players played “soccer,” according to historian Bill Murray in “The World’s Game: A History of Soccer.” The dispute arose when rugby players thought soccer, by restricting players to just kicking the ball and not “hacking (kicking) each other,” would threaten “the essential ‘manliness’ of football, and sneered that such sissy reforms would reduce the game to something more suited to the French.”
The Boston Oneida
Richard Witzig, in his book “The Global Art of Soccer,” claims that “the USA was the first country outside of England to organize a soccer team, the Boston Oneida Football Club in 1862.” This was the start, in North America, of the continuing confusion over what term should be used to define the sport. Oneida won every match it played and never even conceded a goal. Although this team existed only for four years, the popularity of the sport grew in the northeastern universities. Shortly after 1873, “university soccer was nearly forgotten by the meteoric rise of the indigenous USA-football, and USA soccer was forced to hibernate in immigrant enclaves.”
The United States Soccer Federation
The USSF highlights the confusion that has permeated U.S. sporting culture for more than 100 years. At the turn of the 20th century, according to Witzig, the United States had two competing soccer associations, the American Amateur Football Association and the American Football Association, both of which represented soccer clubs across the country. The merged United States Football Association, or USFA, joined the Federation of International Football Association in 1914. This continued until after World War II, when the United States Soccer Football Federation took over running the game. The final name change, in 1974, to United States Soccer Federation, cemented the “soccer” terminology in American sporting cultural language.
References
• The Washington Times: It’s Called Soccer. Deal With It
• US Embassy: Soccer
• Hornet Football: History of Football
• “Spiegel Online”; It’s Called Soccer; Michael Scott Moore; July 2006
• ‘The Global Art of Soccer; Richard Witzig; 2006’

